Overview
This portfolio aims to document my contributions to MooLah
My team of 4 Computer Science students and I were tasked with enhancing a basic Command Line Interface desktop application AddressBook - Level 3 for our Software Engineering project. Over 6 weeks, we chose to morph it into a finance tracker application called MooLah. This enhanced application allows the typical NUS student to manage past expenses with the use of budgets, reminders for future expenses, helpful statistics and user-friendly input formats. It is written in Java, and has about 23k LoC. My main developer responsibility in the team consists of the statistics features across every component.
Summary of contributions
-
Big feature: I have added the ability to generate statistics in MooLah
-
What it does: This features consists of a basic summary of expenses, a side-to-side comparison as well as a trend analysis across different periods of time.
-
Justification: This feature improves the product significantly because the lack of analytic tools to make sense of data is a potential reasons for the problem of poor spending habits to be snowballed. The inclusion of a statistics feature addresses this directly, with varying levels of depths and visual representation the user can choose from.
-
Highlights: As the feature is closely coupled to the budget features and requires to support other dependencies such as undo/redo, constant coordination with other developers is required.
-
-
Code contributed: (Link to RepoSense)
-
Other contributions:
-
Project management:
-
Initiated the renaming of the product to MooLah
-
Reviewed pull requests of team mates
-
Facilitated meetings every Wednesday and Friday and consolidated discussion minutes,
-
Scheduled milestone tasks and ensure that project deliverables are completed on time in the right format.
-
Wrote additional tests for existing features to increase coverage from 52% to 59% (PR #254)
-
-
Enhancements to existing features:
-
Documentation:
-
Documented new statistics features in User Guide
-
Added the implementation of Statistics in Developer’s Guide
-
-
Contributions to the User Guide
We had to update the original AddressBook - Level 3 with instruction for the enhancement that we have added. The following is an excerpt from our MooLah User Guide, showing additions that I have made for the Statistics features. |
Viewing Statistics
Like most of the expense commands, statistics of your expenses can be generated concerning to the primary budget you’re residing on. Read further for the rest of the commands covered under the Statistics section.
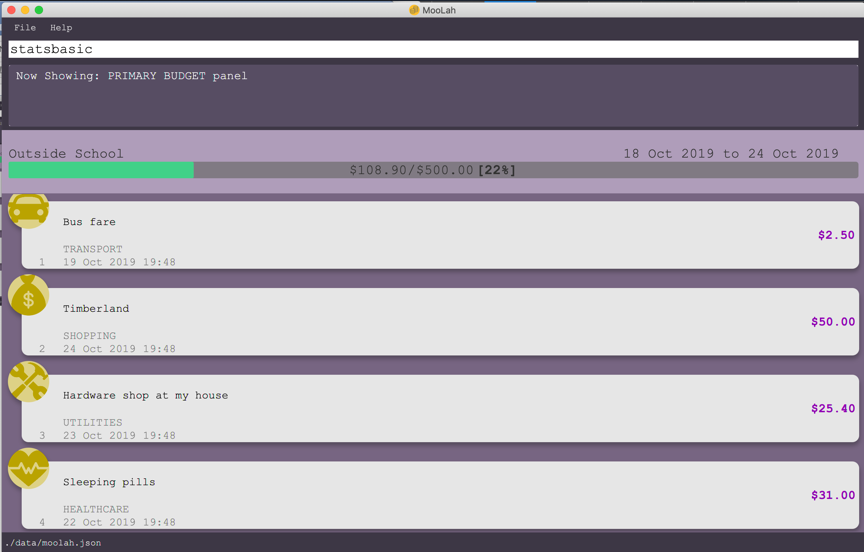
Summary Statistics: statsbasic
This command allows you to have a basic summary of the money spent from their categorical expenses in a given period of their current budget.
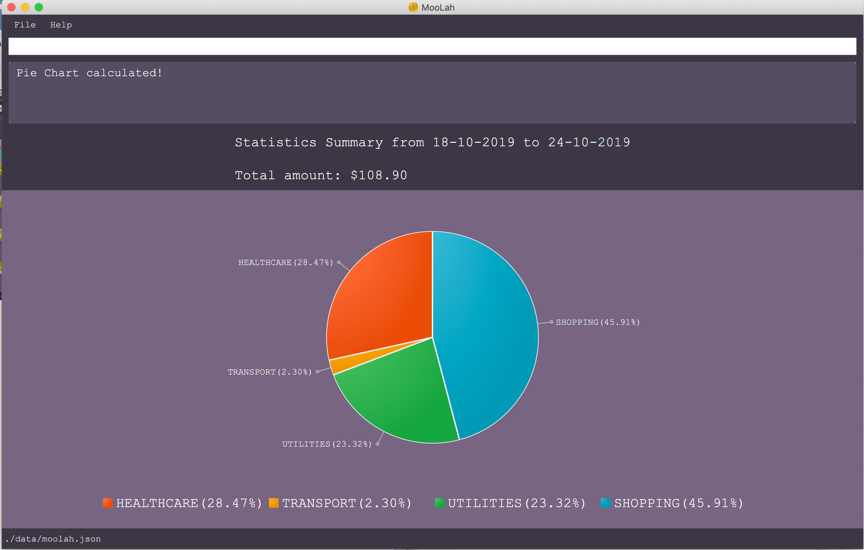
The visual output of the statistics shown is a pie chart, with each piece representing the combined expenditure of all expenses under the category, taken as a percentage of the total expenditure in the budget the command was called.
Format: statsbasic [sd/<START_DATE>] [ed/<END_DATE>]
Tips:
-
There is no need to specify all the parameters if the outcomes of the example usage scenarios below fit your needs
-
If
START_DATEis specified butEND_DATEis empty, the period of the current budget will be considered as the unit of time and statistics is calculated till one unit of time afterSTART_DATE. -
If
START_DATEis empty butEND_DATEis specified, the period of the current budget will be considered as the unit of time and statistics is calculated starting from one unit of time beforeEND_DATE. -
If both
START_DATEandEND_DATEare empty, statistics will be calculated using the start date and end date of the current window of the budget, seen on the top right of the budget progress bar.
Example of configurations:
statsbasic
statsbasic sd/tmr
statsbasic sd/11-11-2018 ed/12-12-2018
Step-by-step guide: For example, MooLah is currently at the "Outside School" budget, and shown below is the view of the current window of the Budget from start of 18 Oct to the end of 24 Oct. There are exactly 4 expenses as shown in the example.
To generate the pie chart for the expenses for this window.
-
Type
statsbasicinto the command box and pressEnterto execute it. -
The result display will display the message "Pie Chart calculated!".
-
The screen will be switched into the Statistics Panel where the Pie Chart will be generated as shown below.
Comparison Statistics: statscompare
This command allows you to have a side-to-side comparison of the money spent from their categorical expenses in 2 periods of their current budget. In this comparison, we provide you with data of both the similarities and differences in these 2 periods.
The visual output of the statistics shown is a table view, with 5 columns, consisting of a category column, and 2 pairs of frequency-total expenditure columns. The cells in the first pair of columns, denoted as "similarity columns" represents the frequency and total expenditure in any existing overlapping interval between the 2 periods, while the cells in the second pair of columns, denoted as the "difference columns" represents the difference in frequency and difference in total expenditure.
Format: statscompare sd1/<START_DATE_1> sd2/<START_DATE_2>
Example of configurations:
statscompare sd1/12-12 sd2/ 1 month ago
statscompare sd2/ today sd1/tmr
statscompare sd2/ 23-09-2019 sd1/1 year ago
Example with expected output:
Test case: Create a new budget, one possible way is addbudget d/school p/3.00 sd/28-10 pr/day.
then enter statscompare sd1/12-12 sd2/ 1 month ago
Expected: A success message of "Statistics Comparison Calculated!" appears with the the title "Statistics Summary: Comparing 12-12-2019 to 12-12-2019 with 12-10-2019 to 12-10-2019" but all entries reflect 0 for frequency and 0.00 for amount.
Growth Statistics : statstrend
This command allows you to see the growth of the money spent from your categorical expenses in fixed units of time between the interval that you’re interested in finding out
The visual output of the statistics shown is in the form of plotted trend lines.
Currently 2 modes of usage can be selected.
The first one is a category
mode where each individual trend lines represents one categories and
every plotted point on a line represents the total expenditure starting from its stated date,
till before the stated date of the next point.
The second mode is a budget mode where only 2 trend lines can be observed.
The first trend line represents the budget limit where every plotted point represents
the budget limit set starting from its stated date,
till before the stated date of the next point.
The second trend line represents the total expenditure for all expenses regardless of category, where every plotted point represents the total expenditure starting from its stated date, till before the stated date of the next point.
Format: statstrend [sd/<START_DATE>] [ed/<END_DATE>] mode/MODE
Tips:
-
There is no need to specify all the parameters if the outcomes of the example usage scenarios below fit your needs. The analysis comes in the form of interval construction followed by the searching of the nearest possible window to be included. The following describes how the interval is constructed with different configurations
-
If
START_DATEis specified butEND_DATEis empty, the end date of analysis is constructed till 32 unit of time afterSTART_DATE. -
If
START_DATEis empty butEND_DATEis specified, the start date of analysis is constructed from 32 unit of time beforeEND_DATE. -
If both
START_DATEandEND_DATEare empty, the start date of analysis is constructed from 16 units of time before the start date of the current window of the current budget and the end date of analysis is constructed from 16 units after the start date of the current window of the current budget.
Example of configurations:
statstrend mode/category
statstrend sd/tmr mode/category
statstrend sd/11-11-2018 ed/12-12-2018 mode/category
Example with expected output:
Test case: Create a new budget, one possible way is addbudget d/school p/3.00 sd/28-10 pr/day.
Next, add an expense to the empty budget with addexpense d/ chicken rice p/2.50 c/food t/28-10
and type statstrend mode/category sd/28-10
Expected: A success message of "Statistics Trend Calculated!" appears with the title "Periodic trendline from 28-10-2019 to 29-11-2019 in the unit of days", 1 trend line for food is observed, with the first plotted point of the line being the highest non-zero point at y-axis = 2.50
Contributions to the Developer Guide
The following section shows my additions to the MooLah Developer Guide for the Statistics features. They showcase my ability to write technical documentation and the technical depth of my contributions to the project. |
Statistics Feature
Implementation
The statistics feature allows users to have an alternative view for the entries in MooLah.
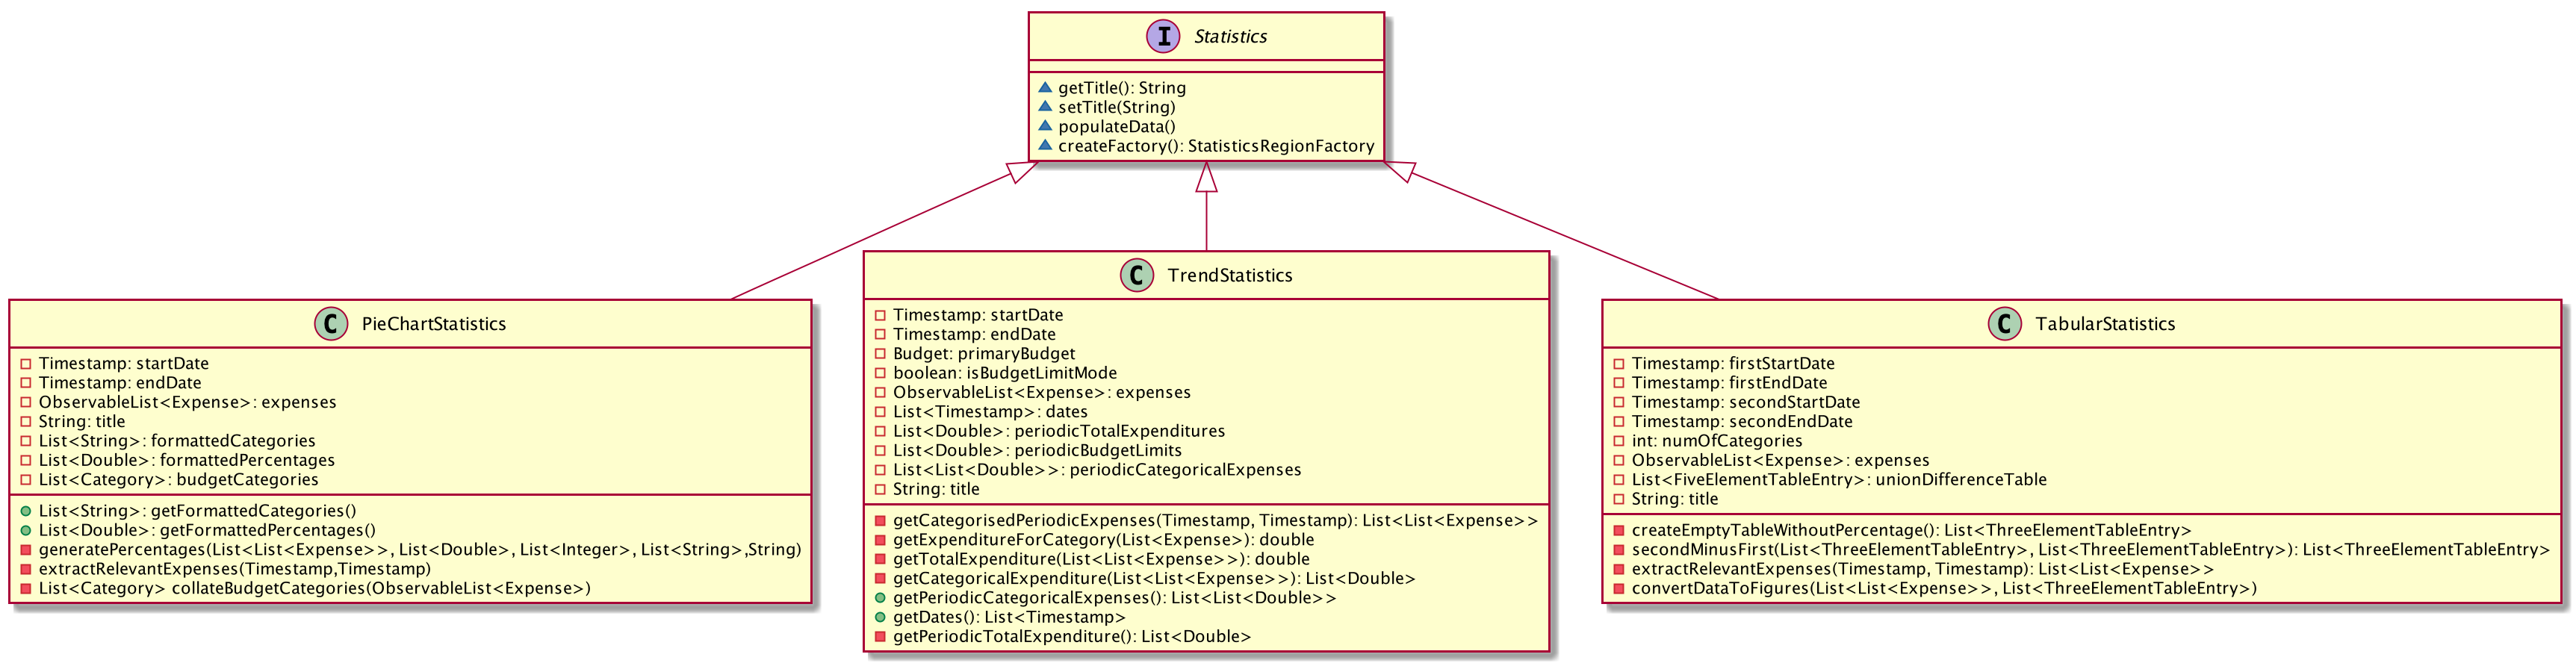
It is facilitated by the Statistics interface, which is part of the model package, and is implemented by 3 classes
PieChartStatistics, TabularStatistics and TrendStatistics. Each of the implementing classes will be invoked when
their respective parsers detect its corresponding command word, which is statsbasic, statscompare and statstrend.
The prefix configurations vary greatly between them as well as the visual representation they create.
Given below is a class diagram to summarise the relationship between Statistics and its implementing classes.
The main entries that Statistics interacts with are Expense class and the Budget class. The entire statistics features only
supports the generating of statistics from only the current budget and responds to the different methods called by
the current Budget object. Every successful interaction will force a switch to the Statistics Panel, where each of
their different visual representations will be generated.
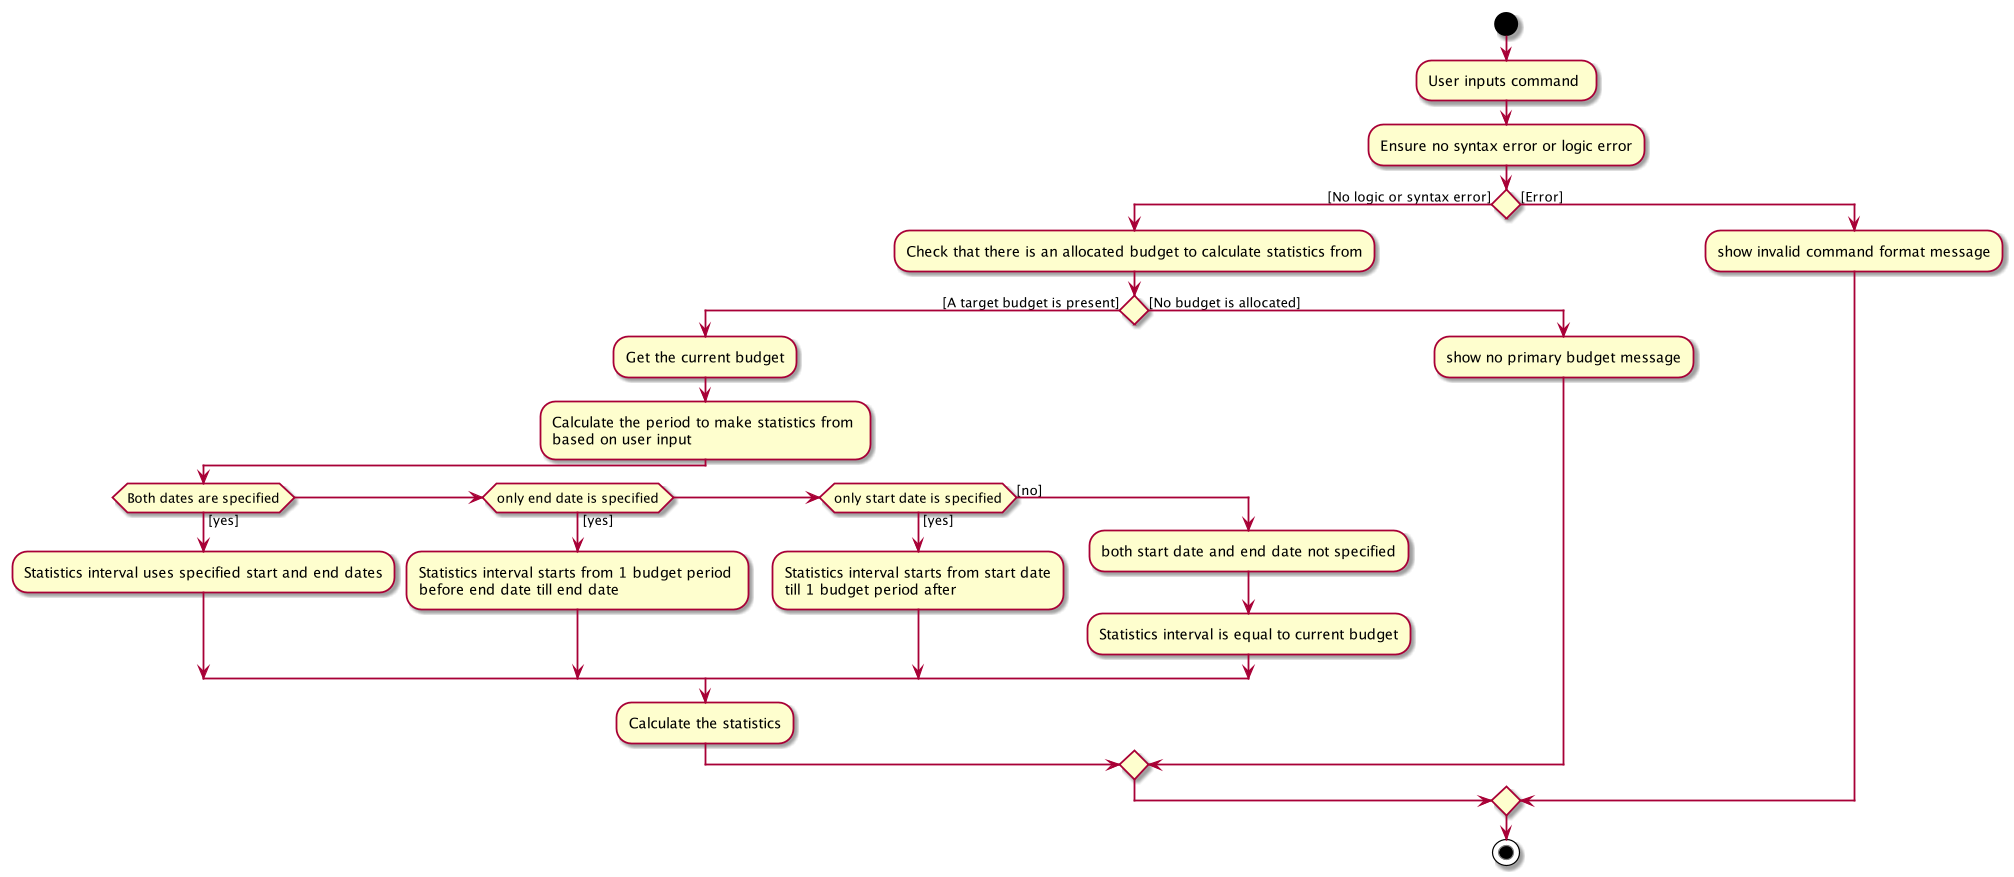
The following activity diagram summarizes how statistics are shown from a current budget after possible user inputs to modify the attributes of the budget.
In the following sections, the implementation details of one of the more complicated command words will be discussed, as well as its design considerations.
statsbasic
The purpose of the statsbasic command word is to request MooLah to visualise the total expenditure across
expenses of different categories as a percentage of the total expenditure of all expenses tracked under the budget
where the command is called. The visual representation used here will be a PieChart.
Given below is an example usage scenario and how the statsbasic command word is handled by MooLah.
Step 1. The user enters the command statsbasic sd/01-10-2019 ed/01-11-2019 to visualise the total percentage of each category
as a percentage of total expenditure across all categories, in the primary budget.
The command is received by MooLahParser, which then creates a StatsCommandParser object,
to subsequently help to parse the input by the user.
Step 2. The newly created StatsCommandParser calls parse("stats sd/01-10-2019 ed/01-11-2019"),
which in turns calls ArgumentTokenizer#tokenize("sd/01-10-2019 ed/01-11-2019", PREFIX_START_DATE, PREFIX_END_DATE) to
split the arguments into its preamble(the start date and end date). This returns an ArgumentMultimap object, argMultimap containing the split input.
Step 3. The StatsCommandParser object creates a StatsDescriptor object desc to hold the start date and end date that was specified by the user.
Depending on the presence of start date and end date, desc will be filled in differently.
If the start date and end date is both specified by the user, the end date will be checked to not be before the start date.
If the end date happens to be before the start date, a ParseException will be thrown
Step 4. The filled desc will be returned to the LogicManager where a new StatsCommand object, statsCommand will be created with desc
Step 5. The LogicManager calls StatsCommand#run(), where the StatsCommand will be validated before getting executed.
Step 6. During execution, StatsCommand calls ModelManager#getPrimaryBudget() to retrieve the primary budget to calculate statistics from.
After which, StatsCommand will call createPieChartStatistics, which takes in desc and the primary budget.
Step 7. To construct the time interval required for statistics, information from desc is being processed.
If there are unspecified inputs inside desc, the time interval will be constructed with some information from the primary budget.
Step 8. The PieChartStatistics object will be created with the constructed interval as well as the expenses the primary budget tracks.
After which, StatsCommand will call the PieChartStatistics implementation of populateData() to fill up its other fields
Step 9. StatsCommand calls ModelManager#setStatistics(statistics) which updates the Statistics attribute in ModelManager.
Step 10. A CommandResult is then created and returned to LogicManager, which will then force a switch
to the Statistics Panel where a Pie Chart will be generated.
The following sequence diagram shows how the statsbasic operation works:
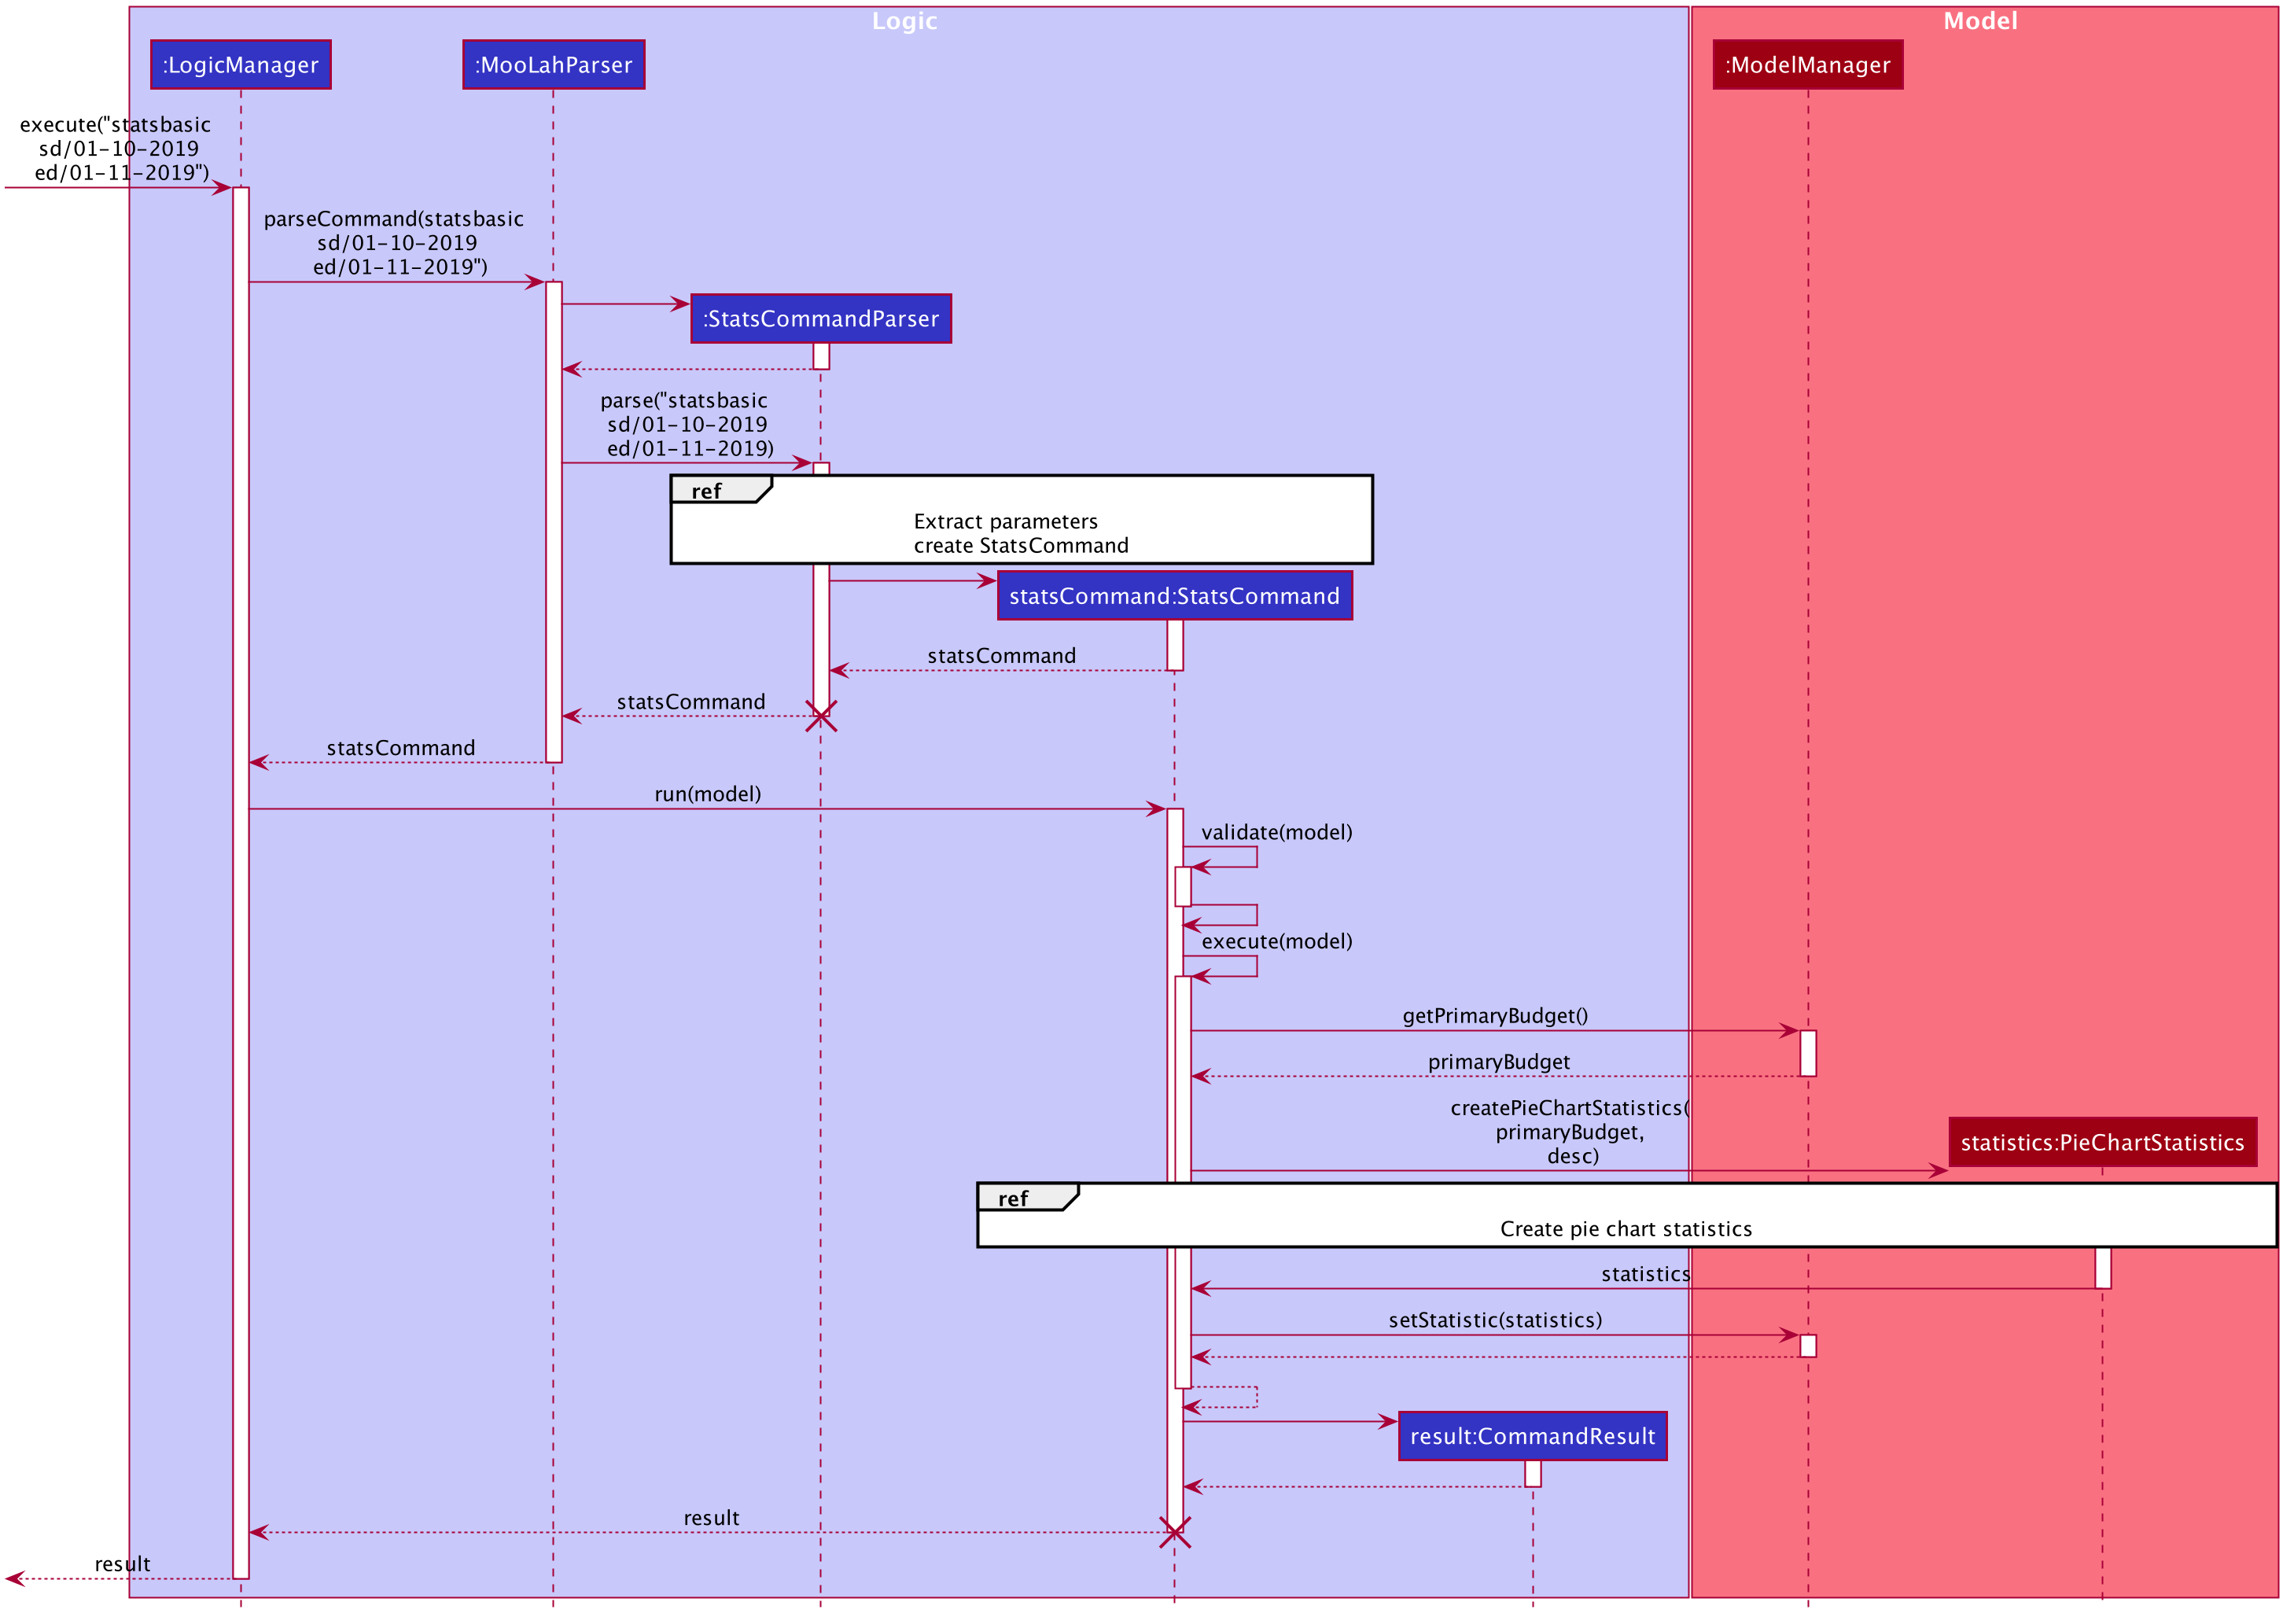
Figure 1. Sequence Diagram for executing a StatsCommand
Design Considerations
When designing the interaction of the command word statsbasic, decisions have to be made on the most
suitable visual representation for statsbasic particular use case.
-
Alternative 1: Table view
-
Pros: Sequential view, can capture number of entries
-
Cons: May be a duplicate of the
ListExpensecommand, just grouping expenses via categories
-
-
Alternative 2: Pie chart
-
Pros: Offers a visual view of size to represent the expenditure under each category
-
Cons: Loses the elements of number of entries in each category
-
-
Solution (Current Implementation): Adopts Alternative 2. It is important that every aspect of the user experience gets covered, and what
MooLahbefore the inclusion ofStatisticsis the appreciation of percentage expenditure in each category of expenses. Expenses can already be observed in its chronological order usingListExpensewhile individual view of expenses under a category can be accessed usingFindExpense. Offering a visual view on expenditure under each category complements with the existing implementation of sequential view in the primary budget.
For more sequence diagrams, you can find them below Figure 1 (here)